Plots
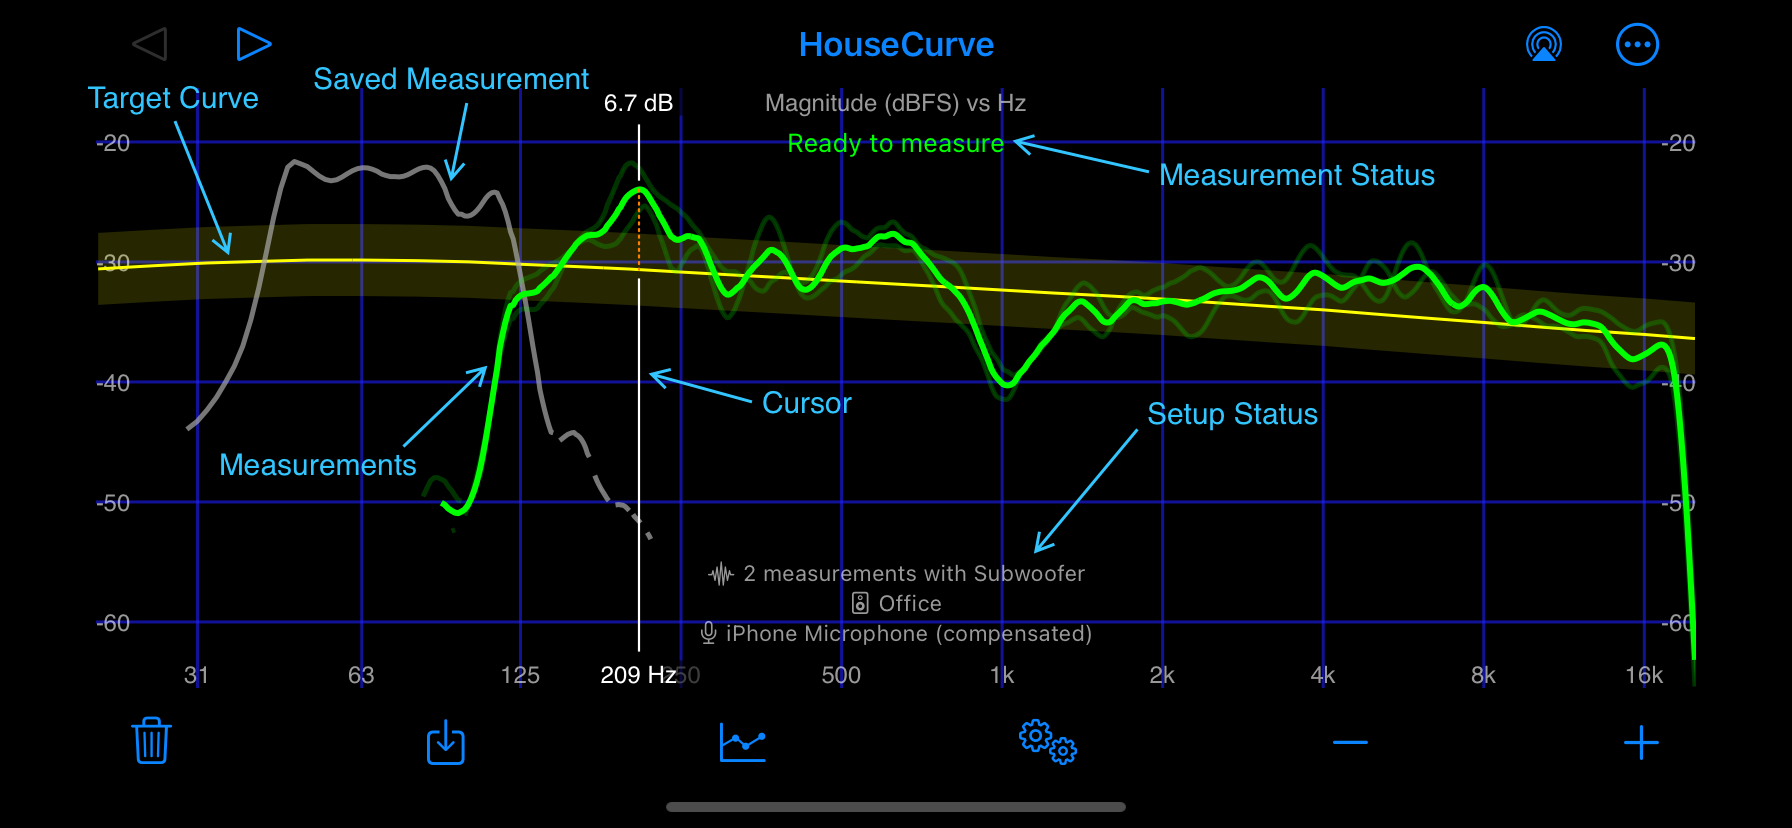
HouseCurve displays a lot of plots. A typical example is shown below.

Target Curve
The target curve is displayed on the magnitude plot in yellow with +/- 3 dB bands. The phase and group delay plots always have a target of zero. The targe curve can be changed by going to Plot Setup.
Saved Measurement
A single saved measurement can be displayed in grey. The name of the measurement is displayed in Setup Status. Choose which saved measurement is displayed by going to Plot Setup.
Measurements
Measurements are displayed on the plot in green. See Plot Mode for details.
Cursor
Tap plot area to show cursor, move with a single finger, tap again to hide.
Measurement Status
HouseCurve displays the status of the measurement process in this area. The status disappears after a few seconds.
Setup Status
HouseCurve displays plot and hardware setup information in this area. The status disappears after a few seconds.
Zoom / Scroll
To zoom into a plot, pinch anywhere on the plot area. The plot can be scrolled left or right with two fingers. Plot zoom and scroll only change the horizontal frequency axis. HouseCurve automatically sets the vertical axis of the plots to show the measurement.