Plot Setup
The Plot Setup screen can be accessed by tapping  from the Sweep, Real Time, Equalize and Curve Edit tools.
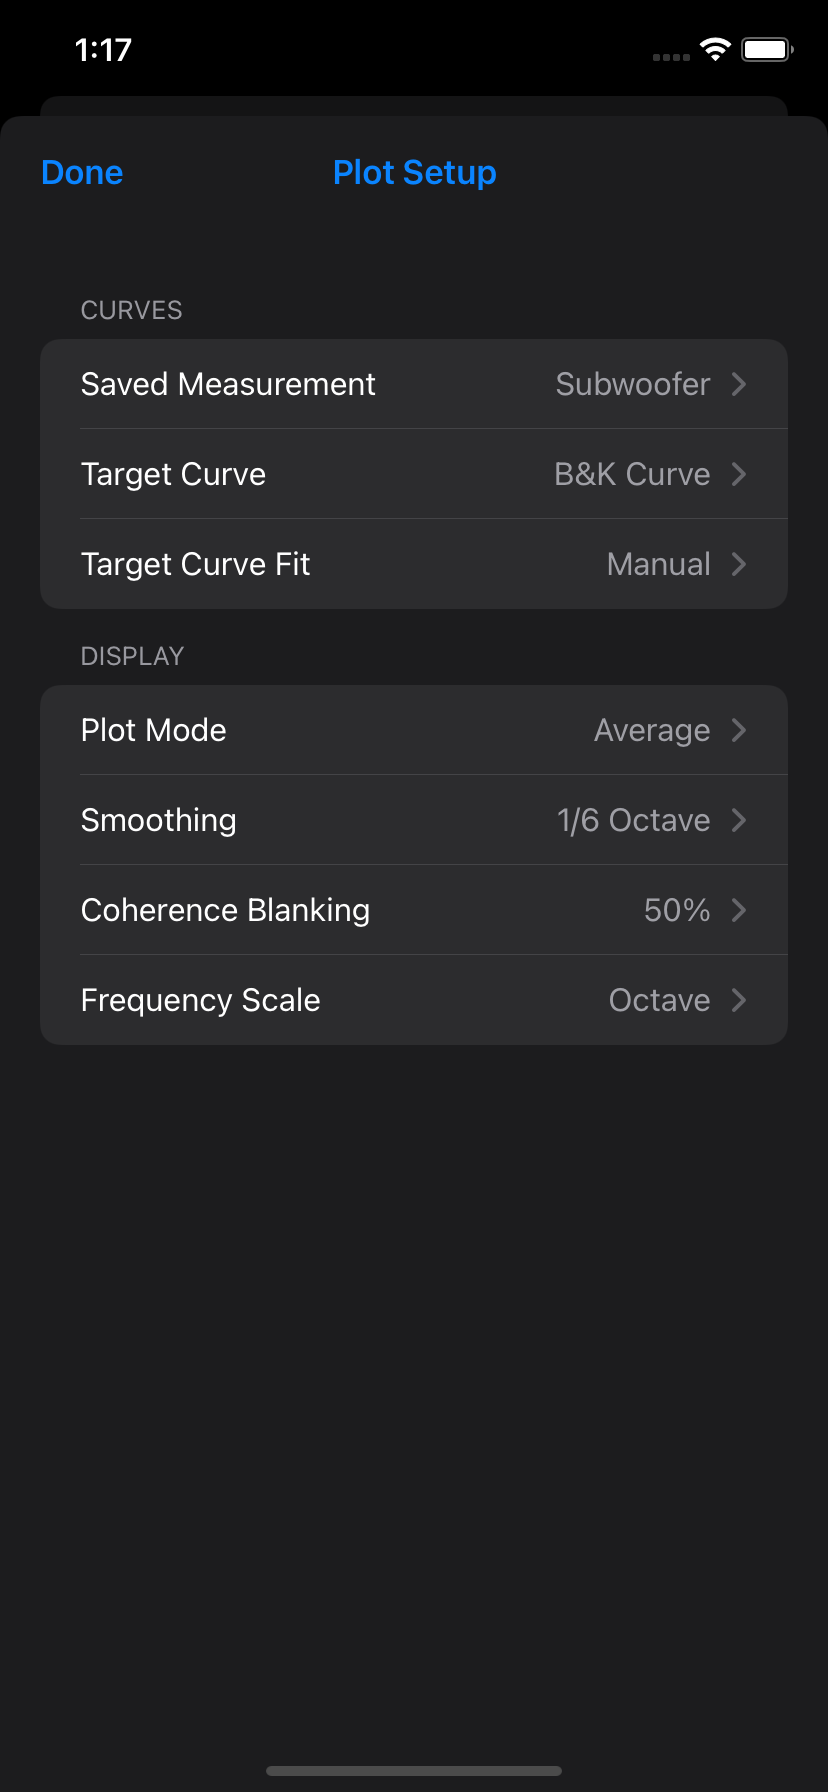
Saved Measurement
Saved Measurements can be displayed on the plot for comparison. Choose “None” to disable.
Target Curve
A target curve is displayed on the magnitude plot to serve as a guide for tuning an audio system.
The curve is positioned on magnitude plots based on the Target Curve Fit setting.
Additional target curves can be loaded by tapping + at the top of the target curve screen. Target curves can be removed by tapping Select.
HouseCurve supports the following curve file format.
Target Curve Fit
By default, the selected target curve is automatically fitted to measurements based on the Plot Mode. In Average mode, the average measurement is used. In History mode, the most recent measurement is used. If there are no current measurements the target curve is fitted to the saved measurement.
Coherence Blanking also affects how the target curve is positioned. Portions of the measurement below the blanking threshold are ignored for fitting.
When automatic fitting is disabled, the curve can be manually positioned by setting a desired dB level. This is useful when you don’t want the curve to move, for example, when applying room correction to left and right speakers separately.
Smoothing
Smoothing can be applied to measurements to make it easier to see trends. To remove smoothing, select None.
Coherence Blanking
Sweep measurements use coherence blanking to hide portions of a measurement that are low quality and should not be used for tuning.
Blanking occurs wherever the measurement falls below the selected signal to noise ratio (blanking threshold). To disable blanking, select Off.
This setting also controls the threshold at which HouseCurve will automatically discard measurements.
Frequency Scale
The frequency axis can have an Octave or Decade scale. This setting applies to all plots.
Plot Modes
HouseCurve can display measurements to suit a given task (with Tuning Bundle purchase). Sweep and Real Time tool have independent plot modes.
Sweep
-
Average - Averages sweep measurements as they are captured. This mode is well suited for tuning an audio system to match a target curve. The average measurement is displayed in bold green. Individual measurements will appear in faded green.
-
History - Displays the latest sweep measurement on top of previous ones. This mode is used to see the effect of an adjustment from a single microphone location. Use this mode for initial audio system setup, such as speaker position or time alignment. The most recent measurement is displayed in bold green. Older measurements appear in green and are faded according to age.
Real Time
-
Live - Displays a short term average of the pink noise measurement (about 5 seconds). Use this mode to see the measurement change as an adjustment is being made.
-
Average - Long term continuous average of the pink noise measurement. Use this mode to quickly capture an average measurement of a listening area by moving the microphone (aka: “moving mic measurements”, or MMM).